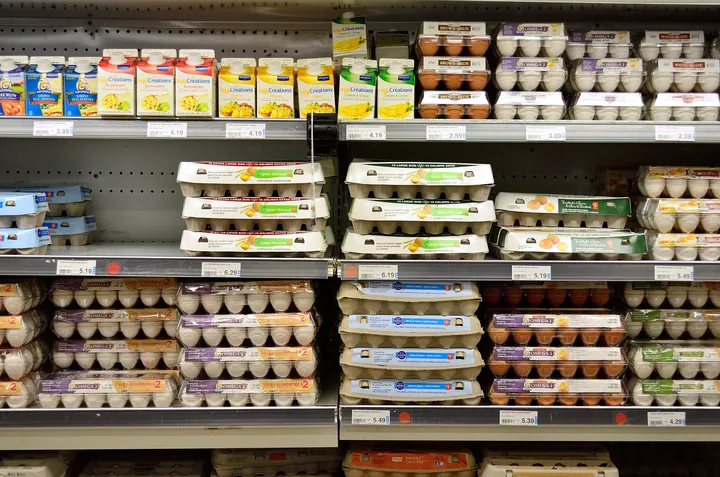
Inflation measures depend on more than the prices collected at shops and service providers. To decide which prices matter, the Bureau of Labor Statistics needs a picture of what households buy and how often. Its Consumer Expenditure Surveys gather that information through two channels: interviews for major or recurring expenses and diaries for frequent purchases. The spending reports help determine the relative importance of categories in the Consumer Price Index (CPI), shaping how individual price movements combine into an average.
Two surveys capture different rhythms
A grocery staple such as bread is a useful way to see why the CPI relies on both kinds of reporting. Food and personal care products are often bought frequently, so the Diary Survey asks participating consumer units to record purchases over a two-week period. The Interview Survey, by contrast, is designed for major and recurring items. BLS describes the surveys as covering different spending rhythms rather than asking one questionnaire to capture every transaction Bureau of Labor Statistics Bureau of Labor Statistics.
A recurring household bill fits the interview side of the design. Quarterly interviews collect information on spending habits, while diaries record the smaller or more frequent purchases that can be easy to forget later. Together, the survey methods give BLS a broader account of household expenditures than either would alone. The reports are collected by the Census Bureau for BLS and include expenditure, income and demographic information Bureau of Labor Statistics.
Spending helps set the weights
The CPI is a weighted measure: price changes in categories that represent a larger share of spending have more influence on the overall index than changes in smaller categories. Household spending data help establish those relative weights. BLS says the Consumer Expenditure Surveys are used primarily to revise the relative importance of goods and services in the CPI’s market basket Bureau of Labor Statistics.
That weighting is why the question “what does it cost?” is joined by “how much do people spend on it?” Imagine, hypothetically, that a category accounts for a substantial share of household budgets while another represents only a small share. If their prices rise by the same percentage, the first category’s price movement would generally contribute more to the broad index because its weight is larger. The example explains the role of weights; it does not describe actual CPI shares or price changes.
From reports to measured prices
Spending reports do not themselves measure inflation. They help identify the market basket and, along with other survey information, where consumers shop. BLS selects geographic areas, retail outlets, specific goods and services, and housing units for price collection. For most items, Consumer Expenditure Survey data help develop the outlet sample and assign price quotes to outlets Bureau of Labor Statistics.
Once prices are collected, recorded changes are weighted by the importance of the item in the spending patterns of the relevant CPI population. BLS then combines the samples and weights to produce an average measure across items and places. The process is more detailed than pricing a single brand or checking a handful of household receipts: statistical sampling selects representative items within categories, while the spending data establish how those categories count Bureau of Labor Statistics.
A useful average, not a household forecast
The CPI’s basket represents average price change for its target populations, not a personalized account. The CPI-U covers urban consumers in the specified areas, while the CPI-W covers a subset of households tied to qualifying wage-earner occupations. People living in rural nonmetropolitan areas and farm households are not covered by those populations Bureau of Labor Statistics.
Even within a covered group, two households can experience different price pressures. A family spending more than average on medical care may feel faster inflation when medical prices rise rapidly; a household using solar energy may be less affected by rising fuel prices. Those differences do not make the CPI meaningless. They show why it should be read as a consistent population-level measure, built from spending patterns and price sampling, rather than as a precise account of any one person’s bills Bureau of Labor Statistics.
Sources & further reading
- Consumer expenditures ↗Bureau of Labor Statistics
- Consumer Price Index questions and answers ↗Bureau of Labor Statistics