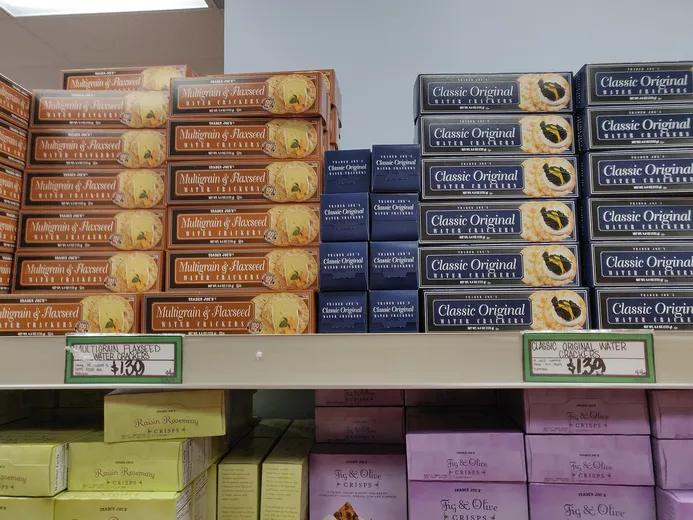
When a price increase eases, the number on the shelf usually does not rewind. Disinflation means the pace of inflation has slowed: prices are still rising, but more slowly than before. Deflation means prices are falling across a measure of goods and services. The distinction matters because a lower inflation rate can offer relief from fresh increases without restoring what households paid in the past. A hypothetical price path makes the difference clear.
The rate and the level are different
Inflation describes how quickly prices change over time; the price level describes how much things cost. A widely used measure, the Consumer Price Index, tracks average price changes for a representative basket of consumer goods and services. It is an index, not a promise that every item or household’s costs move in the same way Bureau of Labor Statistics.
Imagine a hypothetical grocery item that costs $10 in one year and $11 the next. Its price rose 10 percent. If it then costs $11.22 the following year, the increase is 2 percent: inflation has slowed, but the price is still higher than before. That is disinflation. If the price instead fell from $11 to $10.80, that item became cheaper; a decline across a broad price measure would be deflation.
A lower rate does not erase past increases
The arithmetic explains why households can hear that inflation is cooling and still feel that everyday expenses are high. Each new percentage change applies to the price level already reached. Even a much smaller increase adds to that level; it does not undo earlier increases.
For a household, the practical question may be whether wages or other income have caught up with accumulated costs. The CPI alone does not answer that personal question. It measures an average basket for its target population, while actual spending patterns differ. A person with unusually high medical costs, for example, may experience price changes differently from the national average Bureau of Labor Statistics.
September’s reading is a snapshot
The September 2026 CPI for All Urban Consumers rose 0.6 percent on a seasonally adjusted monthly basis, following a 0.4 percent increase in August. Over the 12 months ending in September, the all-items index rose 3.7 percent Bureau of Labor Statistics. These are two comparisons: one month to the previous month, and a year to the same month a year earlier.
The September report also shows why a single headline cannot describe every checkout or bill. Gasoline rose 9.1 percent in September and accounted for over half of the monthly all-items increase, while the food index was unchanged. Shelter rose 0.4 percent. These component movements help explain the index; they do not establish what any one household paid Bureau of Labor Statistics.
What the headline can—and cannot—say
A falling inflation rate is evidence that measured prices are rising more slowly over the period being compared. It is not evidence that the cost of living has returned to an earlier level, or that every category is cooling at the same speed. Nor does a national average settle whether a family can afford its own basket.
That is why it helps to ask two separate questions: Are prices still increasing, and how fast? The first concerns the price level’s direction; the second concerns the inflation rate. Disinflation answers the second: increases have slowed. Only a broad decline in prices would mean deflation, and even then the effect on a household would depend on which prices fell and which did not.
Sources & further reading
- Consumer Price Index questions and answers ↗Bureau of Labor Statistics
- September 2026 Consumer Price Index ↗Bureau of Labor Statistics